The Dashboard is the page you will land on anytime you login. You can always get back to the Dashboard by Selecting it from the left hand menu.
The Dashboard is a landing page to see all the important details for your event. It allows you to manage your event from both a broad and micro level.
The view is set with the event level at the top and the activities below. You are able to click on the action icons next to either level.
Your closest upcoming event will be the event the Dashboard will show unless you have pinned another one of your events.
Pinning an Event
By default, your next event will load each time you land on the dashboard. Click the Pin icon to set a different event as your default. You can use the top two drop-drown menus to get to any past, current, or future events.
To Pin an event Choose the event using the drop down menus at the top of the Dashboard. Once the event has been selected, Click on the Pin icon next to the event name.
Viewing Past Events
To view any past events, use the drop down menus at the top and Select the Year and Event you would like to view.
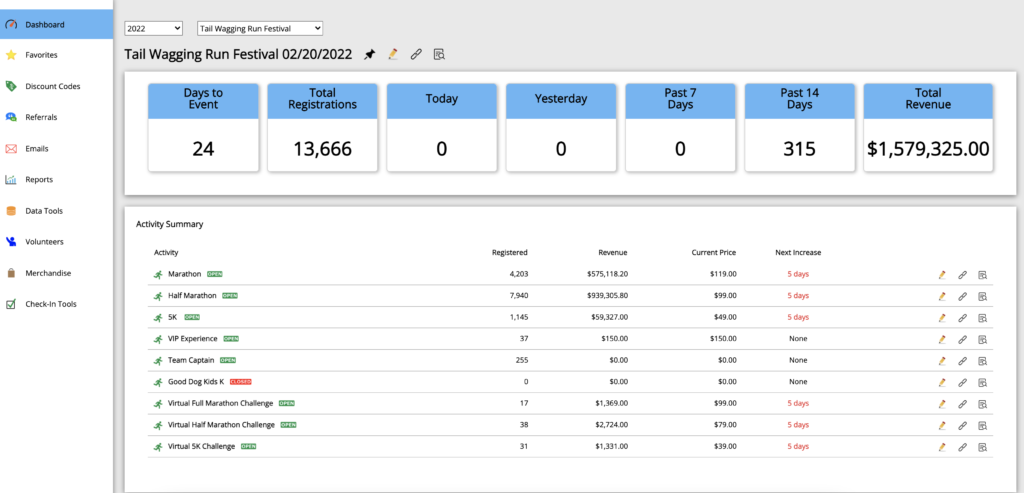
High Level Overview Tiles
The tiles at the top of the Dashboard will give you a high level overview of the event. Here you’ll see tiles with registration trends, revenue totals, and a countdown to your Event date.
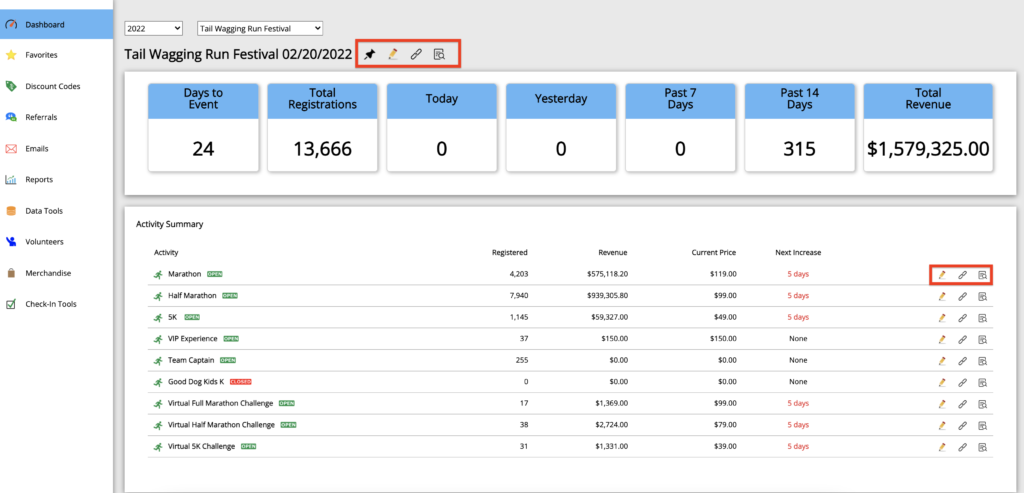
Getting to the Event Editor
To get to the event editor, Click on the Pencil icon next to the event title or activity title(s).
Quick Actions
Quick actions give you the ability go to the event editor, or use tools from the event editor directly from Dashboard.
- Pencil Icon – Click here to go straight to the event editor
- Link Icon – Build a link for the Event at the event level or activity level
- Preview Icon – Opens a new tab window with a preview of either the event level registration page or directly to an activity’s registration page.
Graphs
The dashboard will show the following graphs for an event. The graphs that show days out are defaulted to show 14 days out, but can be adjusted using the slider below the graph.
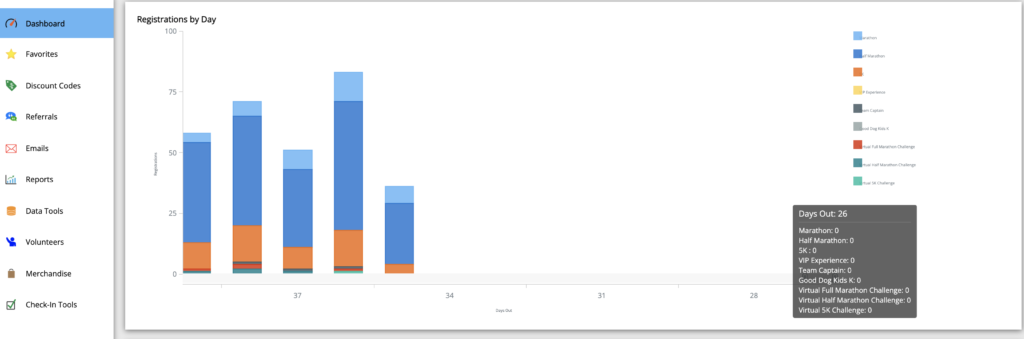
Registrations by Day
This stacked bar chart shows the total number of registrations per day for each activity. Click on an activity in the legend to show or hide it from the graph. The slider at the bottom of the graph allows you to adjust the date range to your preference.
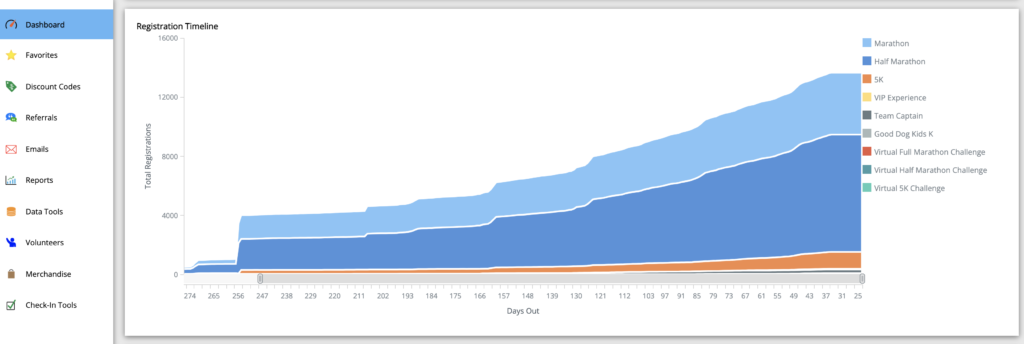
Registration Timeline
This stacked area chart gives a view of the total registrations over time and their relative proportion of the total registrations. Click on an activity in the legend to show or hide it from the graph. The slider at the bottom of the graph allows you to adjust the date range to your preference.
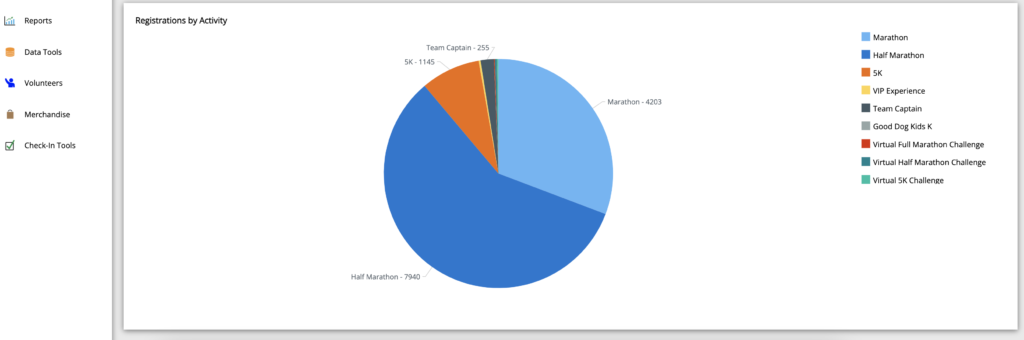
Registrations by Activity
This pie chart shows each activity’s registration as a part of the total for your event. Click on an activity in the legend to show or hide it from the chart.
All event graphs can be found in the Reports section by Selecting the Reports tab from the left hand menu.